The Weis Wave Plugin
The Weis Wave Plugin stands head and shoulders above anything currently available to the trading community. I have been trading for 25 years and have used the Weis Wave for the past three. With its unique wave volume, the Weis Wave helps traders recognize turning points. —Alfred T., Austria
I have to tell you that your Weis Wave has been EXTREMELY useful!
I’ve been trading for a living for over 15 years now… this tool you have provided has made things much clearer to me. —T.K.
The Weis Wave Plugin is the end product of 30 years work to find the most accurate portrayal of volume. The insights gained from this plugin are a great help in anticipating trend changes of varying degree.
Anyone who has watched intraday price movement knows it unfolds in a series of buying and selling waves—a process of building up and tearing down. Prices do not unfold in bundles of equal time. When the natural movement of prices is bound by time, the trend still remains visible. Volume, however, does not fare so well. Subdividing volume into time periods obscures the true force of the buying and selling. The Weis Wave Plugin creates wave charts along with their corresponding wave volume.
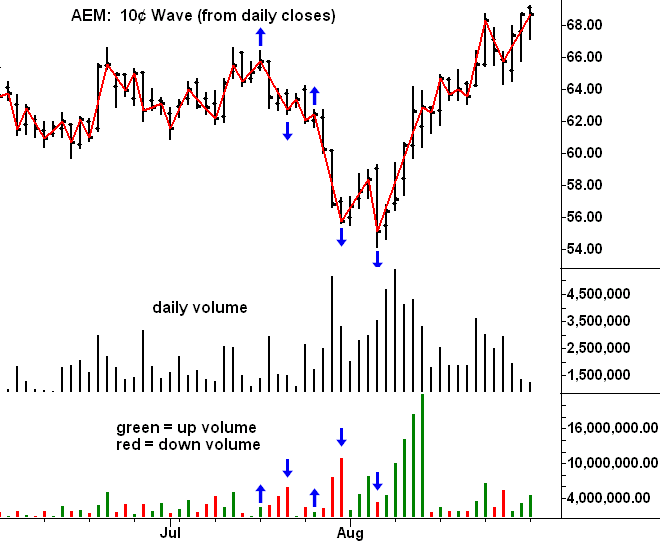
Wave charts were first created by Richard D. Wyckoff. In his famous course on stock market technique, he instructed students to “think in waves.” Wave analysis was an integral part of his trading method. The Weis Wave is an adaptation of Wyckoff’s method that handles today’s volatile markets. It works in all time periods and can be applied to the futures, forex, stock, and commodity markets. You will be amazed at how well the Weis Wave identifies turning points. Many of these same turning points are not obvious on conventional bar charts. Take a look at the daily stock chart of AEM:
Moving from left to right, the first arrow refers to a two day up-wave that ends on July 18. The cumulative volume equals 2.5 million shares. It stands out as a low volume test of the previous up-wave. On the sell-off from this high, the wave volume exceeds all preceding volumes either up or down. Notice the daily volumes do not show such a change in behavior. The third arrow points to a minute, one-day rally with wave volume of 1.75 million shares, the lowest since June 27. It shouts out NO DEMAND. Prices fall about $9 in the next three days and the fourth arrow points to the climactic action.
Notice the next up-wave. It is propelled by the heaviest up-wave volume to date. Here, for the first time, demand appears. This message does not stand out with such clarity on the volume histogram. The last arrow points to the August 4 low made on a one-day decline. Daily volume and wave volume are the same. Yet in the context of the preceding down-waves, the wave volume is very low. Of the three highlighted down-waves, it has the smallest volume and says supply is spent.
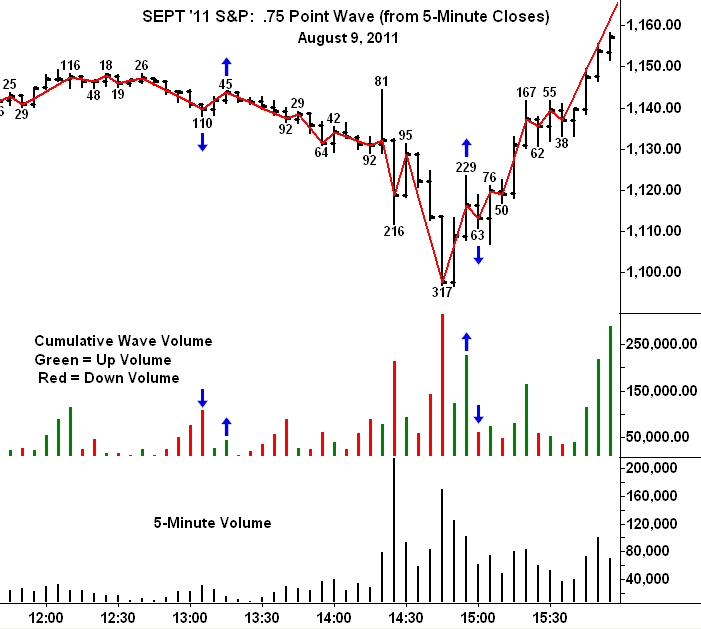
Many of the trades made with the Weis Wave involve pullbacks. For example, when price falls on heavy volume, this is a bearish change in behavior. If the wave volume on the next pullback diminishes sharply, a short trade is established with a close protective stop. This is the case on the September S&P chart where price falls on 110k volume shortly after 13:00. This is the heaviest volume in several hours. The relatively weak volume on the pullback reflects lack of demand. A great short trade unfolded from this high. The five-minute volume reveals none of this information. After the decline below 1100 around 14:45, the next up-wave draws out 229k contracts, an overtly bullish change in behavior. On the next pullback, volume shrinks to 63k, a sign the selling pressure has dried up. The rally from this low hit 1170 on the close!
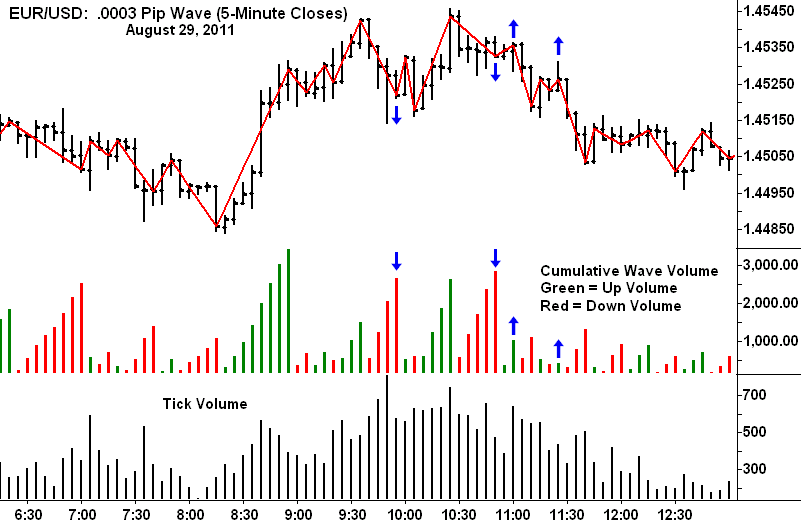
Weis Wave works equally well on Forex charts. The setup on the Euro 5-minute chart is classic. It begins with heavy selling on the decline to the 9:50 a.m. low. After a failed attempt to renew the uptrend, the Euro falls on even larger volume. This is the bearish change in behavior. It is followed by two small, low volume up-waves that can be used to establish short positions. The combination of a bullish or bearish change in behavior followed by a low-volume pullback produces a multitude of trades. Suddenly, you can trade like a counter-puncher.
S&P Chart
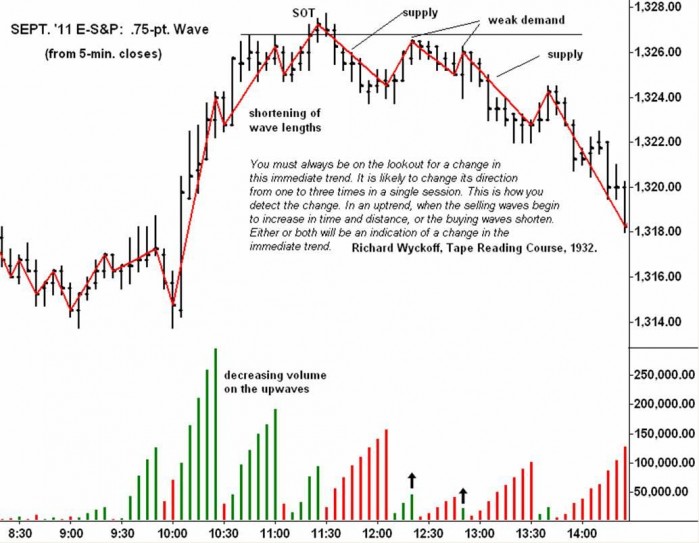
The intraday volatility in the E-S&P makes it a favorite among day traders. Some of the best wave volume setups appear in this contract. Wednesday, July 13 created a number of such trading opportunities. On the 5-minute bar chart of the September ‘11 contract, a .75-point wave is included. In the middle of the chart, I have copied Wyckoff’s statement on how to recognize intraday changes in trend. They are central to reading the wave chart and volume. Within the uptrend on the left-hand side of the chart, you can readily see how the wave lengths and wave volumes diminish as prices move higher. At the top of the third upwave—where the thrust shortens, the wave length decreases in size and the wave volume drops—short positions should have been established. The first downwave from this high draws out massive supply—the heaviest of the day. On the subsequent two rallies, demand evaporated thus offering additional entry points for new shorts. The second of these two upwaves consists of only one 5-minute bar. Without the bearish picture of the wave volume, the strong close on that bar might have caused some traders to close out short positions. Because the waves filter price data, they are not as ephemeral as the price bars. Supply is dominant throughout the rest of the session.
Caterpillar Chart
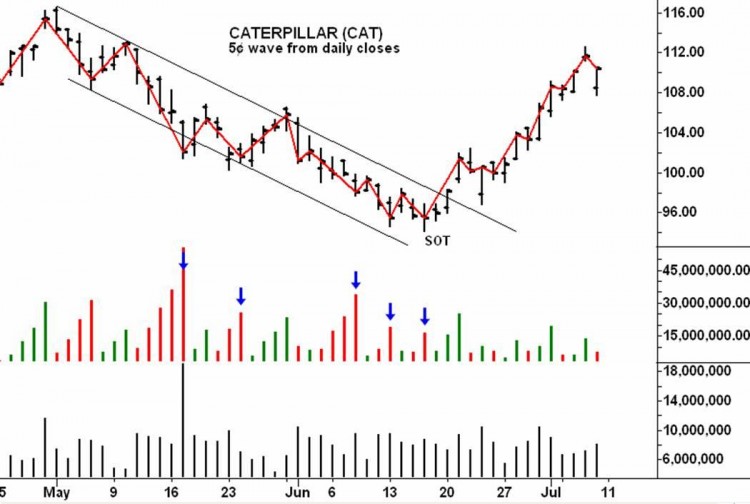
On the daily CAT chart, the wave volume shows how the selling gradually slackens as prices decline to the June low. The bar chart shows the shortening of the downward thrust near the bottom of the price channel. Below the price chart you first see the cumulative wave volume and then the actual, daily volume.
In the week of June 20, the actual volumes all look the same. They look like the tree line on the horizon, a phenomenon typical of many stock charts. The wave volume gives a truer picture of the reduced selling pressure at the low. Notice the leap in wave volume on the first upwave off the low. It reflects aggressive demand and leads to a nice 10% profit.
Because the daily prices are visible, the chart reader can combine the message of the wave volume with the length of the bars and the position of the close—a powerful combination.
The Weis Wave Plugin is compatible with TradeStation®, NinjaTrader7®, NinjaTrader8®, MT4®, and MetaStock® platforms; the Weis Wave plugin for MetaStock® now works on both 32-bit and 64-bit computers.
• CLICK TO LEARN ABOUT PRICING AND HOW TO PURCHASE
NOTICE: The Weis Wave indicator does not provide automatic buy & sell signals. Trading with the Weis Wave is interpretive. The arrows placed on the charts shown here pinpoint areas discussed in the text. They are not part of the software. Any prospective buyer who wants further information on this product should use our contact form and questions will be answered.
